The setup: record sales, compressed profits and a major corporate clean-up
JK Paper Limited is going through an important capital-cycle transition.
At first glance, the reported profit numbers look weak. Net profit has fallen sharply from the FY23 peak. Operating margins have compressed. Depreciation has increased. Borrowings have moved higher. CWIP remains elevated.
But the deeper story is not demand collapse.
The company’s sales are at a record high. Cash conversion remains healthy. The asset base has expanded. Public shareholding has reduced. Institutions have increased ownership. Most importantly, the March 2026 NCLT-approved amalgamation changed the promoter-group structure and simplified the corporate architecture.
That makes JK Paper a restructuring-led capital-cycle setup.
The core question is simple: if margins recover from the current depressed base, how much operating leverage can the enlarged asset base deliver?
1. FY23 vs FY26: sales are at a record high, but margins are crushed
The most important fact in JK Paper’s financials is that sales have not collapsed.
| Metric | FY23 | FY26 | Change |
|---|---|---|---|
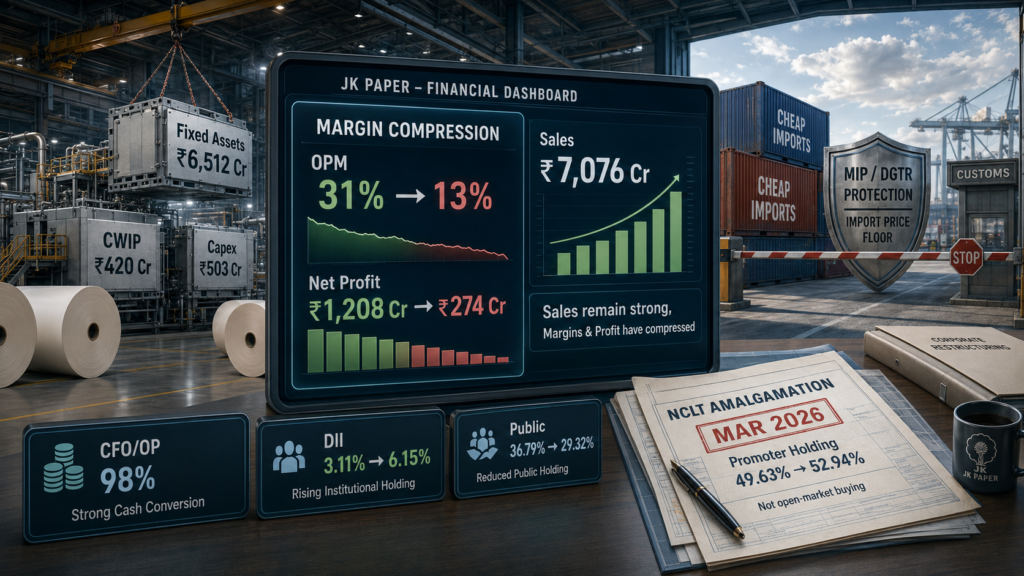
| Sales | ₹6,437 cr | ₹7,076 cr | +10% |
| Operating Profit | ₹2,012 cr | ₹924 cr | -54% |
| OPM | 31% | 13% | -18 percentage points |
| Net Profit | ₹1,208 cr | ₹274 cr | -77% |
| Depreciation | ₹282 cr | ₹377 cr | +34% |
| Interest | ₹222 cr | ₹225 cr | Almost flat |
FY26 sales of ₹7,076 cr are the highest in the available historical table.
But operating profit has fallen from ₹2,012 cr in FY23 to ₹924 cr in FY26. Net profit has fallen from ₹1,208 cr to ₹274 cr.
This is the key point:
JK Paper’s sales are higher than the FY23 super-cycle peak, but operating profit is down 54% and net profit is down 77%.
So this is not a broken-demand story.
It is a margin-collapse story.
The company has grown revenue from ₹6,437 cr in FY23 to ₹7,076 cr in FY26. But expenses have grown much faster, from ₹4,425 cr to ₹6,152 cr over the same period.
That is where the damage is.
Revenue is alive. Margins are broken.
2. FY25 vs FY26: sales improved, but earnings did not
The FY25 to FY26 comparison gives another important clue.
| Metric | FY25 | FY26 |
| Sales | ₹6,718 cr | ₹7,076 cr |
| Operating Profit | ₹928 cr | ₹924 cr |
| OPM | 14% | 13% |
| Other Income | ₹108 cr | ₹43 cr |
| Interest | ₹178 cr | ₹225 cr |
| Depreciation | ₹332 cr | ₹377 cr |
| Net Profit | ₹412 cr | ₹274 cr |
Sales increased in FY26, but net profit still fell.
The reason is a combination of weak operating margins, lower other income, higher interest and higher depreciation.
This is why the reported net profit number alone does not capture the full picture. The company is selling more, but the earnings base is still compressed by cost pressure and capital-cycle accounting.
3. Depreciation is rising, but the main issue is OPM
Depreciation has increased meaningfully.
It moved from ₹282 cr in FY23 to ₹377 cr in FY26, a rise of ₹95 cr.
That matters because depreciation is a non-cash cost. It reduces reported profit even though cash does not leave the company in that year. It also shows that earlier capital expenditure is now entering the fixed asset base.
But depreciation is not the main reason for the profit collapse.
Operating profit fell by ₹1,088 cr between FY23 and FY26, while depreciation increased by ₹95 cr.
So the clean conclusion is this:
Depreciation is adding pressure, but the main earnings killer is the fall in OPM from 31% to 13%.
That is also where the operating leverage lies. If margins recover even partially, the earnings rebound can be sharp because the current profit base is already heavily compressed.
4. The balance sheet shows active asset-building
JK Paper has not stopped building.
| Metric | FY23 | FY26 | Change |
| Fixed Assets | ₹5,756 cr | ₹6,512 cr | +₹756 cr |
| CWIP | ₹124 cr | ₹420 cr | +₹296 cr |
| Fixed Assets + CWIP | ₹5,880 cr | ₹6,932 cr | +₹1,052 cr |
Fixed assets plus CWIP increased from ₹5,880 cr in FY23 to ₹6,932 cr in FY26.
CWIP alone rose to ₹420 cr.
That means the asset-build phase is still active. It would be wrong to say the full capex cycle is completely over.
The better interpretation is this:
A large part of the asset base has already expanded, visible in higher fixed assets and higher depreciation. But elevated CWIP shows that some capital work is still moving through the system.
This is classic capital-cycle behaviour. Margins are depressed, assets are expanding, and the reported P&L looks weak during the transition.
5. Borrowings have increased, so execution matters
The balance sheet also shows that JK Paper is using a more aggressive capital structure.
| Metric | FY25 | FY26 |
| Borrowings | ₹1,885 cr | ₹2,578 cr |
| Investments | ₹610 cr | ₹537 cr |
Borrowings increased by ₹693 cr in FY26.
Investments reduced to ₹537 cr.
A simple borrowings-minus-investments view shows around ₹2,041 cr of net borrowings against investments.
This does not mean the company is structurally weak. Reserves remain strong at ₹5,339 cr in FY26. But it does mean execution matters.
The company has operating leverage, but it also has financial responsibility. If margins recover, the expanded asset base can deliver strong profit improvement. If margins remain weak, higher borrowings and ongoing capex can delay the recovery.
That is the trade-off.
6. Cash conversion is healthy, but cash is being redeployed
The cash-flow statement is one of the most important parts of the JK Paper story.
| Metric | FY23 | FY25 | FY26 |
| Cash from Operating Activity | ₹1,762 cr | ₹613 cr | ₹773 cr |
| Profit from Operations | ₹2,105 cr | ₹863 cr | ₹866 cr |
| CFO/OP | 100% | 80% | 98% |
| Fixed Assets Purchased | ₹224 cr | ₹253 cr | ₹503 cr |
| Acquisition of Companies | ₹586 cr | ₹470 cr | ₹239 cr |
| Free Cash Flow | ₹1,552 cr | ₹365 cr | ₹282 cr |
Even in a weak margin year, JK Paper converted operating profit into cash efficiently. FY26 CFO/OP stood at 98%.
That is important. The cash engine is not broken.
But the company is not letting that cash sit idle. It is being redeployed into assets and acquisitions.
In FY26, JK Paper generated ₹773 cr of CFO. In the same year, it spent ₹503 cr on fixed assets and ₹239 cr on acquisition of companies.
Together, fixed asset purchases and acquisition outflows absorbed ₹742 cr.
That is almost the entire FY26 CFO.
This is the real JK Paper playbook:
Cash is generated. Cash is redeployed. Assets are consolidated. The balance sheet gets larger. Free cash flow remains positive, but compressed.
This is active reinvestment through the cycle.
7. The March 2026 NCLT amalgamation changed the promoter structure
The most important shareholding point in JK Paper is this:
The promoter holding increase should not be mistaken for open-market promoter buying.
Promoter holding rose from 49.63% to 52.94% in March 2026. But the reason was the March 2026 NCLT-approved amalgamation / composite scheme, not direct market accumulation.
The entity-level shareholding makes this clear.
| Promoter Entity | Before | Mar 2026 |
| Bengal & Assam Company Ltd | 47.00% | 43.92% |
| J.K. Credit & Finance Ltd | 0.09% | 5.63% |
| Accurate Finman Services Ltd | 0.13% | 1.15% |
| Total Promoter Holding | 49.63% | 52.94% |
If this were simple open-market buying, the pattern would look different.
Instead, Bengal & Assam’s percentage reduced, while J.K. Credit & Finance and Accurate Finman Services increased sharply. That points to internal group restructuring and fresh share allotment under the NCLT-approved scheme.
This is the correct framing:
JK Paper’s promoter holding increased because the group structure changed through amalgamation and share allotment. It was not a standard promoter-buying signal.
That does not make it unimportant. It simply changes the interpretation.
The company used the restructuring route to simplify and consolidate the corporate structure at the cycle bottom.
8. What the NCLT clean-up achieves
The March 2026 NCLT-approved amalgamation is not just a technical corporate action. It is central to the JK Paper story.
The scheme helped reshape the group structure through fresh share allotment and internal consolidation.
The old corporate structure had multiple moving parts. The NCLT route helped bring assets and ownership lines into a cleaner structure without relying only on cash outflow.
That matters because JK Paper was already deploying significant cash into capex and acquisitions.
In FY26 alone:
| Deployment | FY26 |
| Fixed Assets Purchased | ₹503 cr |
| Acquisition of Companies | ₹239 cr |
| Total | ₹742 cr |
The NCLT route allowed the company to continue its asset-consolidation strategy while preserving operating cash for capex and business requirements.
This is the core of the restructuring playbook.
9. Public float reduced, while institutional ownership improved
The broader shareholding pattern also changed meaningfully.
| Category | Jun 2023 | Mar 2026 | Change |
| Promoters | 49.64% | 52.94% | +3.30 ppt |
| FIIs | 10.46% | 11.59% | +1.13 ppt |
| DIIs | 3.11% | 6.15% | +3.04 ppt |
| Public | 36.79% | 29.32% | -7.47 ppt |
DIIs almost doubled from 3.11% to 6.15%.
FIIs also increased from 10.46% to 11.59%.
Public shareholding reduced from 36.79% to 29.32%.
Part of the public-shareholding reduction reflects the changed equity structure after the promoter-group allotment. But the shareholder count also tells an important story.
| Metric | Mar 2025 | Mar 2026 |
| Number of Shareholders | 1,56,134 | 1,31,792 |
The number of shareholders fell by 24,342 from the March 2025 peak to March 2026.
So while the promoter holding increase was restructuring-led, public participation also reduced meaningfully during the weak earnings cycle.
This does not guarantee future returns. But it shows ownership shifting while reported profits are depressed.
10. Government import protection can support realisations
One major headwind for Indian paper and paperboard companies has been low-priced imports.
When imported paperboard sets the lower price benchmark, domestic producers struggle to improve realisations even when sales volumes are healthy.
That pressure is now being addressed through policy action.
The Minimum Import Price framework on Virgin Multi-layer Paper Board created a floor against ultra-cheap imports in that category. DGTR has also taken trade-remedy actions involving paperboard imports from countries such as China, Chile and Indonesia.
For JK Paper, this is not a guaranteed profit trigger.
It is a realisation support.
If cheap imports stop setting the lower price benchmark and domestic demand remains healthy, even a modest improvement in paperboard realisations can lift margins from the depressed FY26 base.
The key word is support, not guarantee.
11. The operating leverage setup
JK Paper has record sales, compressed margins, higher depreciation, elevated CWIP, increased borrowings and strong cash conversion.
That combination creates operating leverage.
The company’s FY26 sales were ₹7,076 cr, the highest in the available historical table. But OPM was only 13%, compared with 31% in FY23.
If margins recover even partially, the impact on operating profit can be meaningful.
That is the upside case.
But the risk is also clear.
Borrowings have increased. CWIP remains high. Capex and acquisition outflows continue. If realisations stay weak or input costs remain elevated, the recovery can take longer.
So this is not a risk-free setup.
It is a restructuring-led operating-leverage setup.
The final view: JK Paper is a capital-cycle restructuring story
JK Paper is not a simple cheap-stock story.
It is a capital-cycle restructuring story.
The ingredients are visible:
Sales are at record levels. Margins are crushed. Depreciation has increased. Fixed assets and CWIP are higher. Borrowings have risen. Cash conversion remains healthy. Operating cash is being redeployed into capex and acquisitions. Promoter holding increased because of the March 2026 NCLT-approved amalgamation, not because of open-market buying. Public shareholding reduced, while DII and FII ownership improved.
The risks are clear.
If paper realisations stay weak, input costs remain elevated, or the enlarged asset base fails to earn adequate returns, the recovery can be delayed.
But if the paper cycle improves even partially, JK Paper can benefit sharply because sales are already high and margins are deeply compressed.
That is the real operating-leverage setup.
Disclaimer
The views, analyses and data presented in this article are for informational and educational purposes only. This content does not constitute financial, investment, legal or tax advice. Stock investing involves market risks, and past performance is not indicative of future results. Readers should consult a SEBI-registered financial advisor or conduct independent research before making investment decisions.